
How many users do you need in your AB test?
In this article I will introduce you to my online calculator for calculating the sample size needed for your AB test and go over some examples. To understand why calculating the sample size is important and to understand terms like statistical power read more here.
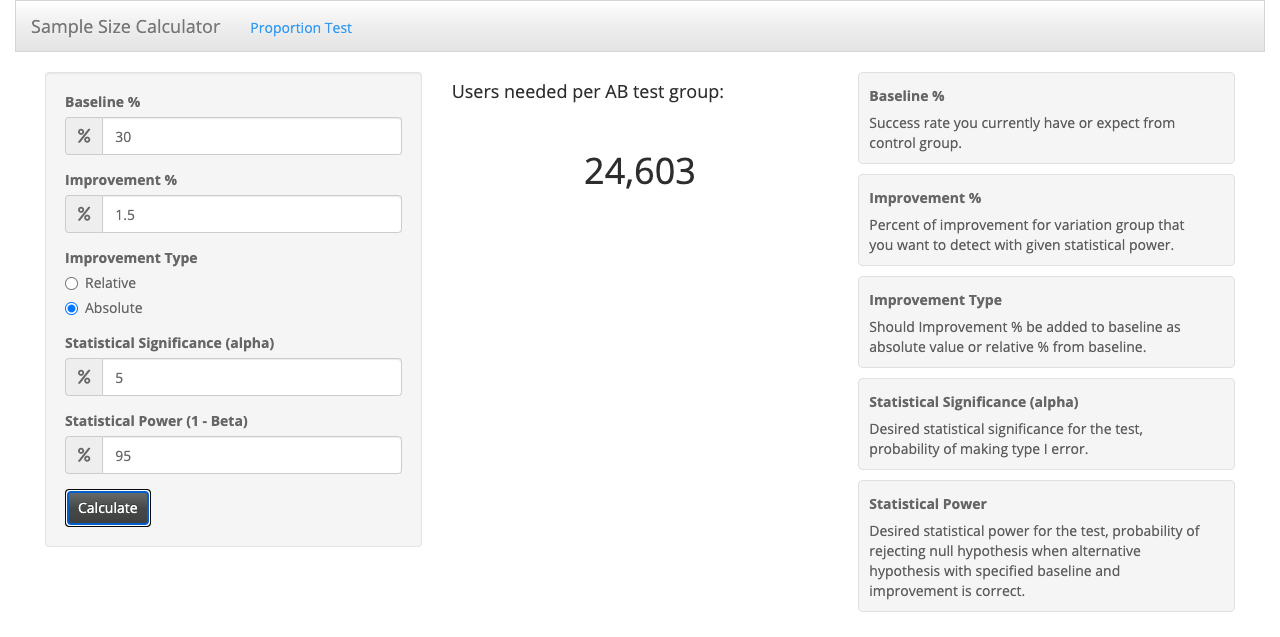
Sample Size Calculator
You can find the calculator here:
It takes some time to load because the server is running the app on request only, not to waste resources all the time.
In order to estimate the sample size needed, you need to specify:
- Statistical significance ($\alpha$): probability of seeing difference when there is none
- Baseline %: baseline success rate that you currently have or expect the control group to have. For example, if you are testing retention day 1 then use the current retention rate that you have. If you are testing click-through rate (CTR) then use the current CTR that you have.
- Improvement %: what is the minimum improvement that you want to detect, improvement that matters to you and your business.
- Improvement Type: you can assume improvement in absolute terms or relative to the baseline. For example, if the baseline retention rate is 30% and you set absolute improvement type and improvement percentage of 5% then you are calculating sample size needed to to detect difference of 30% (control) and 35% (variation). If you set relative improvement of 10% that means you want to detect difference of 30% (control) and 33% (variation). 3% of improvement is coming from 10% of 30% baseline.
- Statistical power ($1-\beta$): probability of detecting a difference when the true difference is specified by the baseline and the improvement you selected, for the specified statistical significance.
With this understanding, you can use the calculator to estimate needed sample size per group. We are currently only talking about the case when the variable that you want to measure is a 0-1 variable. Each user either clicked on the ad (1) or he didn’t (0). Next I will show some examples from realistic use cases.
Examples
As my background is in mobile gaming industry, we will go over some examples of estimating the sample size for:
- Day 1 retention of a mobile game
- Conversion rate from non payer to payer in a mobile game
- Click-through rate on an ad in digital marketing
Day 1 - Retention Rate
Let’s say you made some improvement of early gameplay for your game and you want to see if your retention rate day 1 improved. You will run an AB test, sending 50% of users to the old version of your game (control group) and 50% of users to your new, hopefully improved version of the game (variation group).
First, we need to set the statistical significance. We will use the usual 5%. That part is easy.
The Baseline is also easy. You just check your last month retention rate or something similar. Let’s say you have day 1 retention rate of 30%.
Now the question is, what is the minimum improvement we care about. If we improved the retention rate by only 0.1% we might not care about that. Is 1% something we care about? 1.5%? 2%? Let’s say we want to be able to detect 1.5% absolute increase in retention. In other words 5% relative increase from 30% (to 31.5%).
The last thing to choose is the statistical power. Say our developers and game designers put in a lot of effort to make this new version of the game, so we don’t want to miss detecting an improvement, in case there is one. We want statistical power of 95%.
With these assumptions you need 24,603 users per AB test group, so 49,206 users in total.
Conversion rate from non-payer to payer
Let’s say about 4% of your users become payers. Some become payers right away, some after 1 day, some after 30 days, some after 1 year. In order to set up a “complete” metric and save some time, you may want to measure conversion rate day 7. By day 7 usually 3.4% of your users convert to payers (so 0.6% convert sometime after 7 days from install).
We use statistical significance of 5%.
Baseline is 3.4%.
We care about relative improvement of 7%, or in absolute terms 0.238% increase.
We want statistical power of 80%.
This time we need 94,069 users per AB test group. That is almost 190k users for just one AB test! If you are not a big hit game these numbers are too high. So now you can play with changing the improvement rate you want to detect or with statistical power. If you set relative improvement to 15%, which is 0.51% in absolute terms, then you need “only” 21,246 users per AB test group, which is acceptable. But if conversion rate increases by 0.3%, you might miss it.
Click-through rate
When measuring click-through rate (CTR) on ads, we look at how many people have seen the ad (impressions) and how many clicked on the ad (clicks).
In this case let’s go with 10% statistical significance, because if we use an ad that has the same CTR as some other we are using, but we think it’s better, then the downside is not that big. Usually you would use multiple ads at the same time anyway.
By asking your marketing team or checking marketing dashboards you find out that baseline CTR is 0.8%.
We care about absolute improvement of 0.15%.
We want statistical power of 90%.
These assumptions result in 66,031 impressions per AB test group. That is not as hard as to get as 66,031 users, but if that is still too much we can play with the assumptions and understand how these values interact. If we have a fixed budget for the test, and we know the CPI, CTR and store conversion rate, we can estimate the cost per impression and thus the overall cost of the test. Then we can see which statistical power and other assumptions we can squeeze into that budget.
Conclusion
Even though you often won’t be able to get as many users or impressions to have the desired statistical power and significance, as the business cost will be too large, it is useful to understand what statistical power and significance can be expected. We need to set up some minimum number of observations that will give us at least a decent statistical power and significance. Otherwise we don’t even need to bother with AB testing.
Note
When doing an AB test and calculating the sample size, you shouldn’t stop the test before reaching the needed sample size, even if you get a significant result from your test statistic. If you do, you will not have the promised statistical significance. To read more about that I recommend this great post by Evan Miller.